Recently,Institute of Blue and Green Developmentat Shandong University, in collaboration with multiple research institutions, published a research paper titled “Tracking grid-level freshwater boundary exceedance along global supply chains from consumption to impact” in the journalNature Water. Led by Professor Zhao Xu of Shandong University, the study was jointly completed by researchers from the University of Groningen, Tsinghua University, University College London, Zhejiang University, and other institutions. Professor Zhao Xu from Shandong University, Researcher Wang Xiaoxi from Zhejiang University, Professor Meng Jing from University College London, and Professor Klaus Hubacek from the University of Groningen are the co-corresponding authors of the paper. Dr. Hou Siyu from the University of Groningen, Dr. Huo Jingwen from Tsinghua University, and Professor Zhao Xu from Shandong University are the co-first authors. Shandong University is the lead institute of the paper.
In the context of globalization, the impact of consumption behavior has long exceeded geographical boundaries. Many countries rely on imports of water-intensive products to alleviate pressure on domestic water resources, but this may shift the burden of water stress to the exporting countries, further exacerbating local water pressure and threatening the achievement of Sustainable Development Goals SDG 6.4 (ensuring sustainable water extraction and supply to address water scarcity) and SDG 12 (ensuring sustainable consumption and production patterns). Therefore, there is an urgent need to establish a high-spatial-resolution inventory of freshwater boundary exceedance (i.e., the phenomenon where water use exceeds the sustainable threshold of water resources in specific spatial-temporal scales) on a global scale and precisely link it to the impact of final consumption. This will help accurately identify hotspots and key sectors of water scarcity driven by consumption along global supply chains, thereby optimizing the spatial layout of the economy and ensuring global water security. However, accurately identifying hotspots of freshwater boundary exceedance across multiple spatial scales and effectively tracing them back to final consumption remains a challenge that needs to be addressed.
In this study, we developed a global-scale, high-spatial-resolution, multi-sectoral, and low-uncertainty model for assessing freshwater boundary exceedance driven by consumption. By integrating 15 global hydrological models driven by ISIMIP2a, 5 global environmental flow requirement (EFR) methods, and the multi-region input–output model EMERGING, the model enables precise tracing of grid-level freshwater boundary exceedance to the final consumption. Based on this model, the study reveals the impact of consumption activities in 245 economies on freshwater boundary exceedance across different spatial scales, including grids, cities, river basins, and countries, providing a scientific basis for accurately identifying consumer responsibility for water scarcity.
The study finds that in 2015, the total freshwater boundary exceedance at the 5-arcmin grid scale globally was 3,021 km³, accounting for 64% of the global total water withdrawal. Although these exceedance areas only covered 4.6% of the global land area, they held 42% of the global population (3.1 billion people) and encompassed almost all major breadbaskets or arid areas between 10° N and 50° N (Figure 1 of the paper). The agricultural irrigation sector, including cereals, oil seeds, edible fruits, and other crops, collectively contributed 70% of the global freshwater boundary exceedance. Hotspots of irrigation exceedance are widespread in major cereal- and oil seed-producing regions, including the North China Plain, Tarim Basin, Indus River Basin, Deccan Plateau, Tigris–Euphrates Basin, Nile River Basin, Murray–Darling Basin in Australia, Pacific coastal basins of the Americas, and the Great Plains of the United States (Supplementary Figure 1 of the paper). Electricity production contributed 18% of global exceedance, with hotspots scattered in areas with high electricity demand, including the eastern coast of China, the Indian Peninsula, northeastern United States and northwestern Europe (Supplementary Fig.1f). The manufacturing sector contributed 7% of the global exceedance, followed by the domestic sector (including household and services) at 6%. The exceedance hotspots caused by water withdrawal of both these two sectors were in densely populated areas, especially major manufacturing city clusters, including the Beijing–Tianjin–Hebei region, Yangtze and Pearl river delta, Chengdu–Chongqing city cluster in China, Hanoi in Vietnam, Japan–Pacific Rim city cluster, New Delhi and Mumbai in India, western Europe, and eastern United States (Supplementary Fig.1g,h). Livestock contributed only 0.2% of global exceedance (Supplementary Fig.1e). The sector-specific details of this study reflect the contributions of water withdrawals by different sectors to each exceedance hotspot, a facet often overlooked in previous research. For instance, the exceedance hotspots in the urban clusters of Western Europe and the northeastern United States are mainly driven by local water demand for electricity generation. These hotspots are often neglected in studies that focus solely on the irrigation sector or employ aggregated spatial scales.
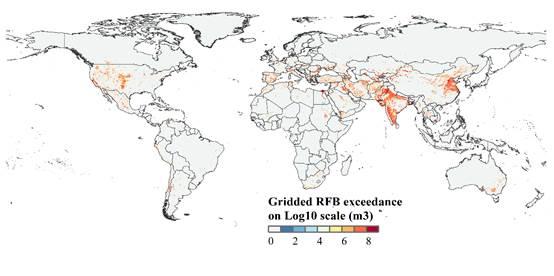
Figure 1: Global grid-scale RFB exceedance in 2015. Global RFB exceedance in 2015 at a 5-arcmin grid scale. The colour map is shown on the log10scale.
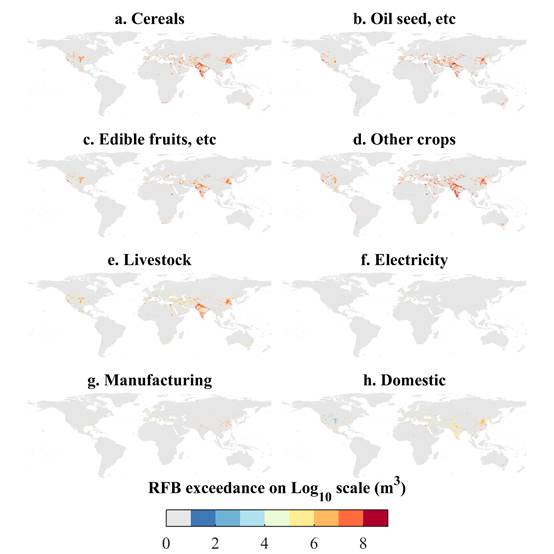
Supplementary Figure 1: Sector-specific regional freshwater boundary (RFB) exceedance at the 5 arcmin grid scale in 2015.
The study further links grid-scale freshwater boundary exceedance to the consumption impact of 245 economies and 135 economic sectors globally. In 2015, about three-quarters (73%) of global exceedance was driven by consumption in ten major countries or regions, including China, India, the United States, the European Union, Pakistan, Iran, and Egypt (Figure 2c of the paper). In terms of per capita consumption, countries in Central Asia and the Middle East and North Africa (MENA) region led the rankings in per capita consumption responsibility. Countries such as the United Arab Emirates, Kuwait, Oman, Turkmenistan, Qatar, Saudi Arabia, Libya, and Iraq, where per capita consumption exceeded 1,500 m3capita−1along the entire global supply chain (Figure 2d). Following these countries were Australia (1,461 m³ capita−1), Canada (1,032 m³ capita−1), the United States (949 m³ capita−1), and the EU28 (496 m³ capita−1). In contrast, the per capita responsibility of consumers in India and China was below the global average (435 m³ capita−1).
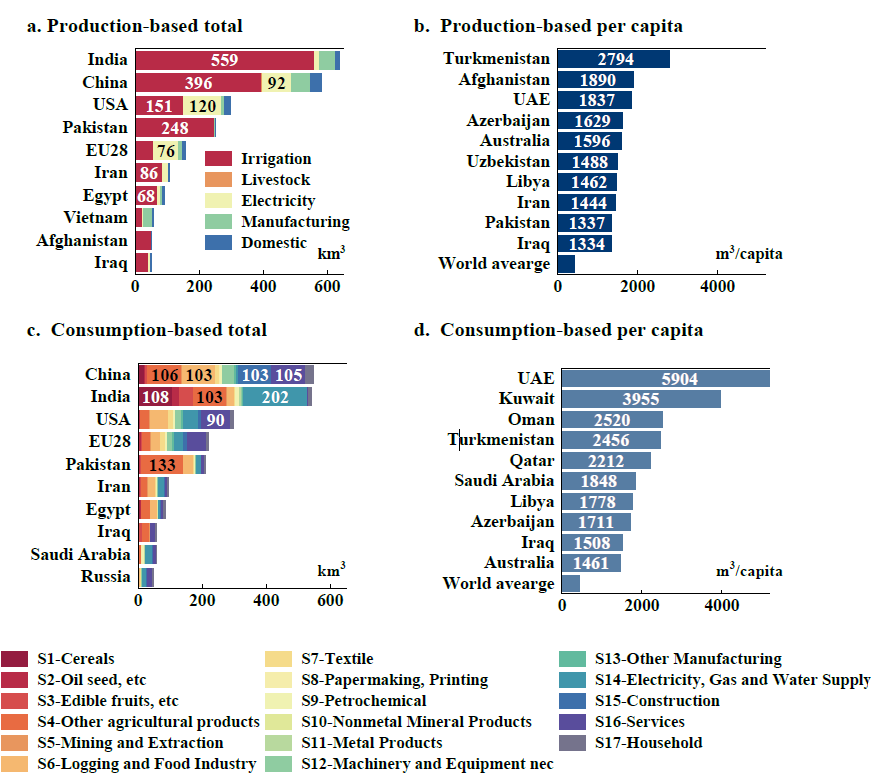
Figure 2: Top ten economies and sectors for production-based and consumption-based freshwater boundary exceedance footprint in 2015.
In 2015, 24% of global regional freshwater boundary (RFB) exceedance was embodied in internationally traded products and services, with major contributions from agricultural sectors such as cereals, oil seeds, edible fruits, and nuts. Due to the inclusion of more nations, we have been able to identify RFB exceedance at the consumption end for more emerging and developing economies, which was not possible in previous work. The study finds that the MENA countries outsourced 16.2% of its consumption-based RFB exceedance to water-stressed South and Central Asia, particularly India, Pakistan and Iran, by importing sugars, cereals and edible fruits. This could worsen seasonal water scarcity in the Ganges, Indus, and Tigris–Euphrates river basins. We found that exceedance hotspots in emerging economies are mostly in major cities, such as Tianjin, Shanghai, Guangzhou, Hanoi, Ho Chi Minh City and Bangkok. These cities feature world-class ports, abundant labour and a relatively strong manufacturing base. The export of textile products and machinery and equipment is the main causes of their RFB exceedance, with most exports flowing to developed economies, such as Western Europe, Japan, and the United States.
In summary, based on the planetary boundary framework and environmental flow requirement methods, this study identifies hotspots of freshwater boundary exceedance across different spatial levels globally. Such insights can facilitate the tracing of global water depletion hotspots along the supply chain and the assignment of responsibilities at finer scales. The grid-level freshwater boundary exceedance inventory provided by this study also offers important scientific support for the implementation of China's rigid water constraint system. This work was supported by the National Key R&D Program of China (2023YFE0113000, X. Zhao) and other funds.
Full text link: https://www.nature.com/articles/s44221-025-00420-z


 Address: No. 180 Wenhua West Road, Weihai City, Shandong Province, China
 Tel:+86-0631-5688246
 Email: whqyy@sdu.edu.cn

